Elections (Archived)
After the 2016 election, Pennsylvania voting no longer suited to a ‘T’

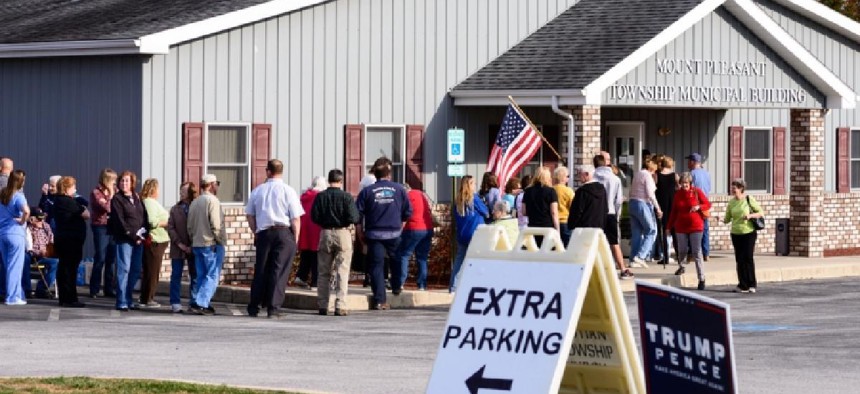
People stand wait to vote in the Nov. 8 election in Mount Pleasant – Bill Dowling for Shuttersock
Pennsylvanians split right down the middle in the 2016 presidential election. Only 64,347 votes – 1 percent of the total – separated the state’s winner, Donald Trump, from its loser, Hillary Clinton.
As that stark math illustrates, there are two Pennsylvanias – something that a county-by-county analysis of the election reaffirms. And they are clearly defined by population growth – or lack thereof.
The 11 Pennsylvania counties that voted for Clinton saw a population gain of 117,719 between 2010 and 2015, according to US Census estimates. While the Great Recession was a rough ride everywhere, these areas tended to have better shock absorbers against the bad economy. Things were built, people were settling in and jobs were to be found more readily than in most other parts of the country.
Over the same period, the 56 Pennsylvania counties that voted for Trump saw a net loss of 11,857 people. Here, the Great Recession never ended. Businesses have closed, younger generations are moving away in search of jobs and a better way of life. Trump’s Pennsylvania looks out its window and sees no hope in the last eight years of change.
In short, it was the economy, stupid. And that forgotten lesson first popularized in 1992 by Clinton’s husband, President Bill Clinton, was what defined Pennsylvania’s election turnout.
Some GOP counties are doing well economically: Pittsburgh’s suburban Butler and Washington in the Southwest; and the small Dutch Country urban centers of Franklin, Cumberland, York, Lancaster, Berks and Northampton in the Southeast. Furthermore, two Northeast Democratic counties, Lackawanna and Monroe, have lost population lately.
But for the most part, places that are seeing growth went for Clinton, while places that are seeing stagnation or decline voted for Trump.
Economic forces shaped other important shifts in the presidential vote. Take the shift away from the historic first Obama election in 2008 to the Trump election in 2016. Obviously, the Democrats lost vote percentage overall in the course of being defeated.
Yet Clinton actually gained a bit in four big urban counties: Allegheny in the Southwest and Philadelphia, Montgomery and Chester in the Southeast. In Delaware County, she held her own. In other counties, though, Clinton’s numbers were down from Obama’s 2008 numbers.
Crucially, she was wiped out in small cities and rural areas where the economy has yet to fully rebound. Typically, these counties have depended on steel, coal, lumbering and light manufacturing – and now natural gas in a few favored areas.
From 2008 to 2016, the Democratic presidential vote margin collapsed by a jaw-dropping 25 points in the Northwest’s Elk County, which in 1990 was a swing county. Across the broad sweep of Pennsylvania to the west and north, the Democrats’ presidential vote share was down by 15 points or more.
Blair and Cambria Counties are next-door neighbors in the Allegheny Mountains, each with a small city (Altoona and Johnstown, respectively) to call their own. But Altoona, based on railroads, was traditionally Republican, while steel-based Johnstown over the ridge was traditionally Democratic.
Two weeks ago, they both voted for Trump in equal proportions. But while Blair swung only 7 points away from Clinton compared to Obama’s 2008 tally, Cambria swung 19 points away to the Republican side.
All the counties where Clinton performed well, or not so bad, compared to Obama, host prestigious colleges and universities. She carried Centre County, home of Penn State, dropping only 5 points from 2008. She dropped 3 points in Cumberland County, home to Dickinson; 4 points in Lancaster, home to Franklin & Marshall; and 6 points in Union and Lehigh Counites, home to Bucknell and Muhlenberg, respectively.
Conversely, counties with third-tier universities were not swayed by Clinton. Take, for instance, Clinton County, home of Lock Haven University, where Democrats still do well. Yet Clinton County did not vote for Clinton. In fact, she dropped 17 points there compared to Obama in 2008.
Turnout was another obvious difference between the two campaigns. Every county that Clinton won saw lower voter turnout. But 34 counties that Trump won experienced a jump in total voters.
Two counties along the Mason-Dixon Line, Bedford and Fulton, have long been among the most Republican in the state. But in the presidential race this year, for the first time, they were as lopsidedly Republican as Philadelphia was lopsidedly Democratic.
For decades, a cliché has held that Pennsylvania politics is shaped like a “T.” The Southwest and Southeast are expected to command liberal Democratic majorities while middle and northern slices of the state go Republican.
That was never fully accurate. But as of 2016, another shape better defines Keystone State politics. That’s roughly the boundary of Blue Mountain from southwest to northeast, separating the lowlands and near ranges that border the Northeast Corridor from the upland ridges and plateaus that fill Western Pennsylvania and the Northern Tier. It’s a line between growth and frustration. One side is increasingly linked to the greater Northeast Corridor, where the action is; the other feels cast aside.
Politically, Pennsylvania no longer looks like a “T.” Maybe it should be called it a “forward slash.” Today’s Democrats have increasing cultural and economic grounds in common with Republican counterparts in the southeastern third of the state, clustered along the I-95 and I-81 corridors. Beyond Blue Mountain to the north and west, Pennsylvanians of both parties are grappling with different challenges.
Eventually, shared social and business contacts may come to trump philosophy and party when the time comes to vote and make policy.
For a detailed, illustrated county-by-county analysis of voting trendlines in Pennsylvania during the presidential election, click here.
